SaaS & Software
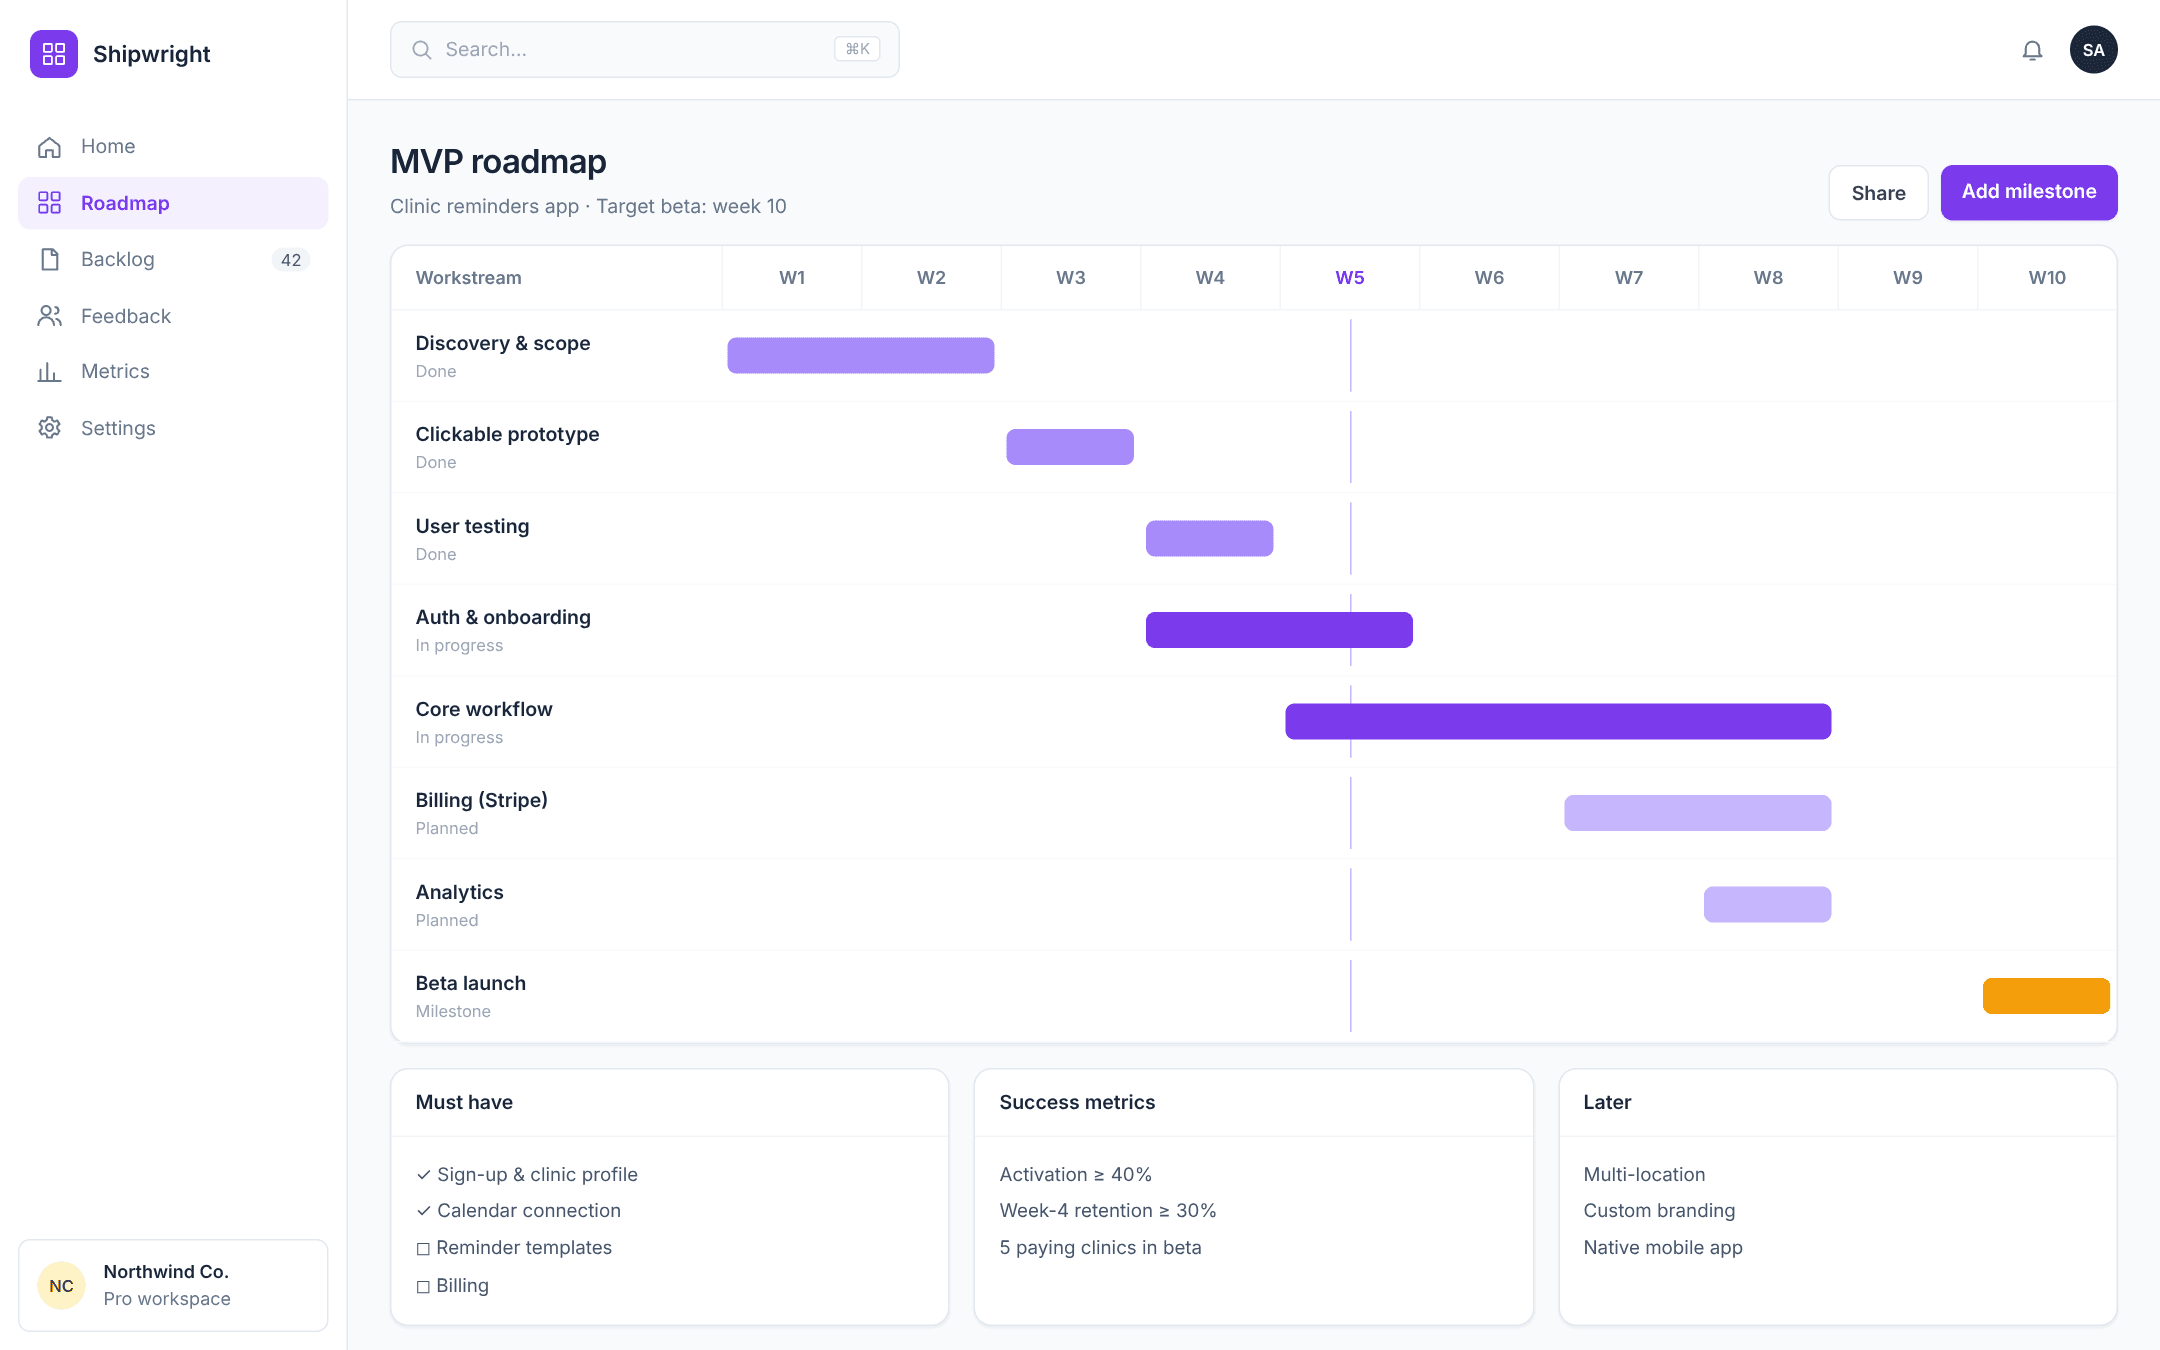
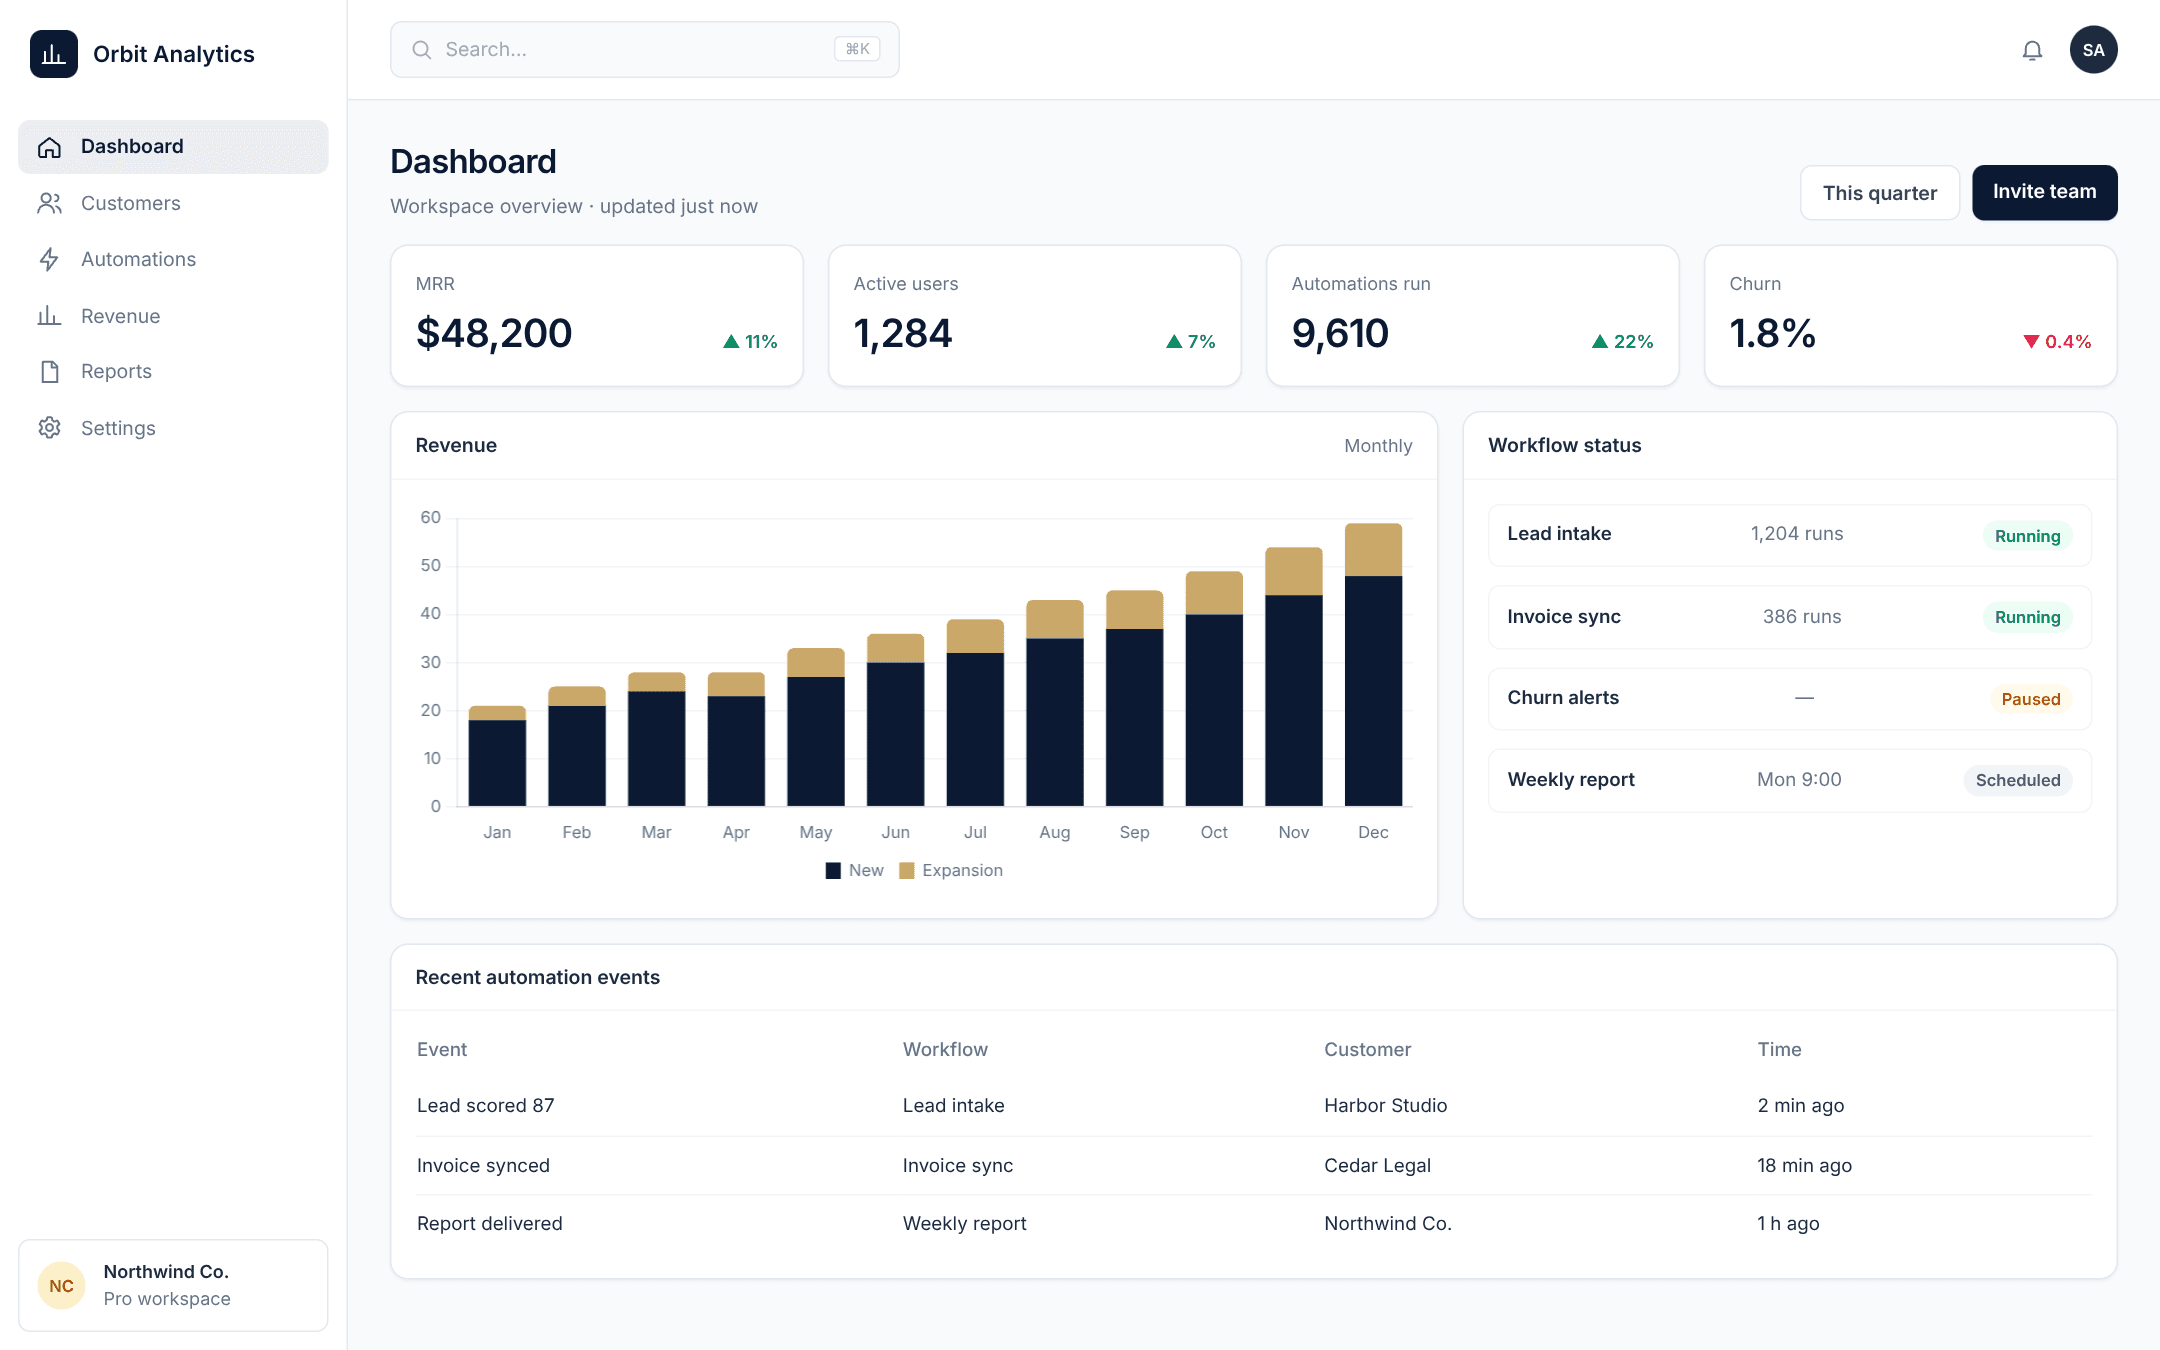
Custom AI SaaS Development
Plan, build and launch AI-powered SaaS products on a scalable foundation.
Explore Service : Custom AI SaaS DevelopmentSaaS & Software
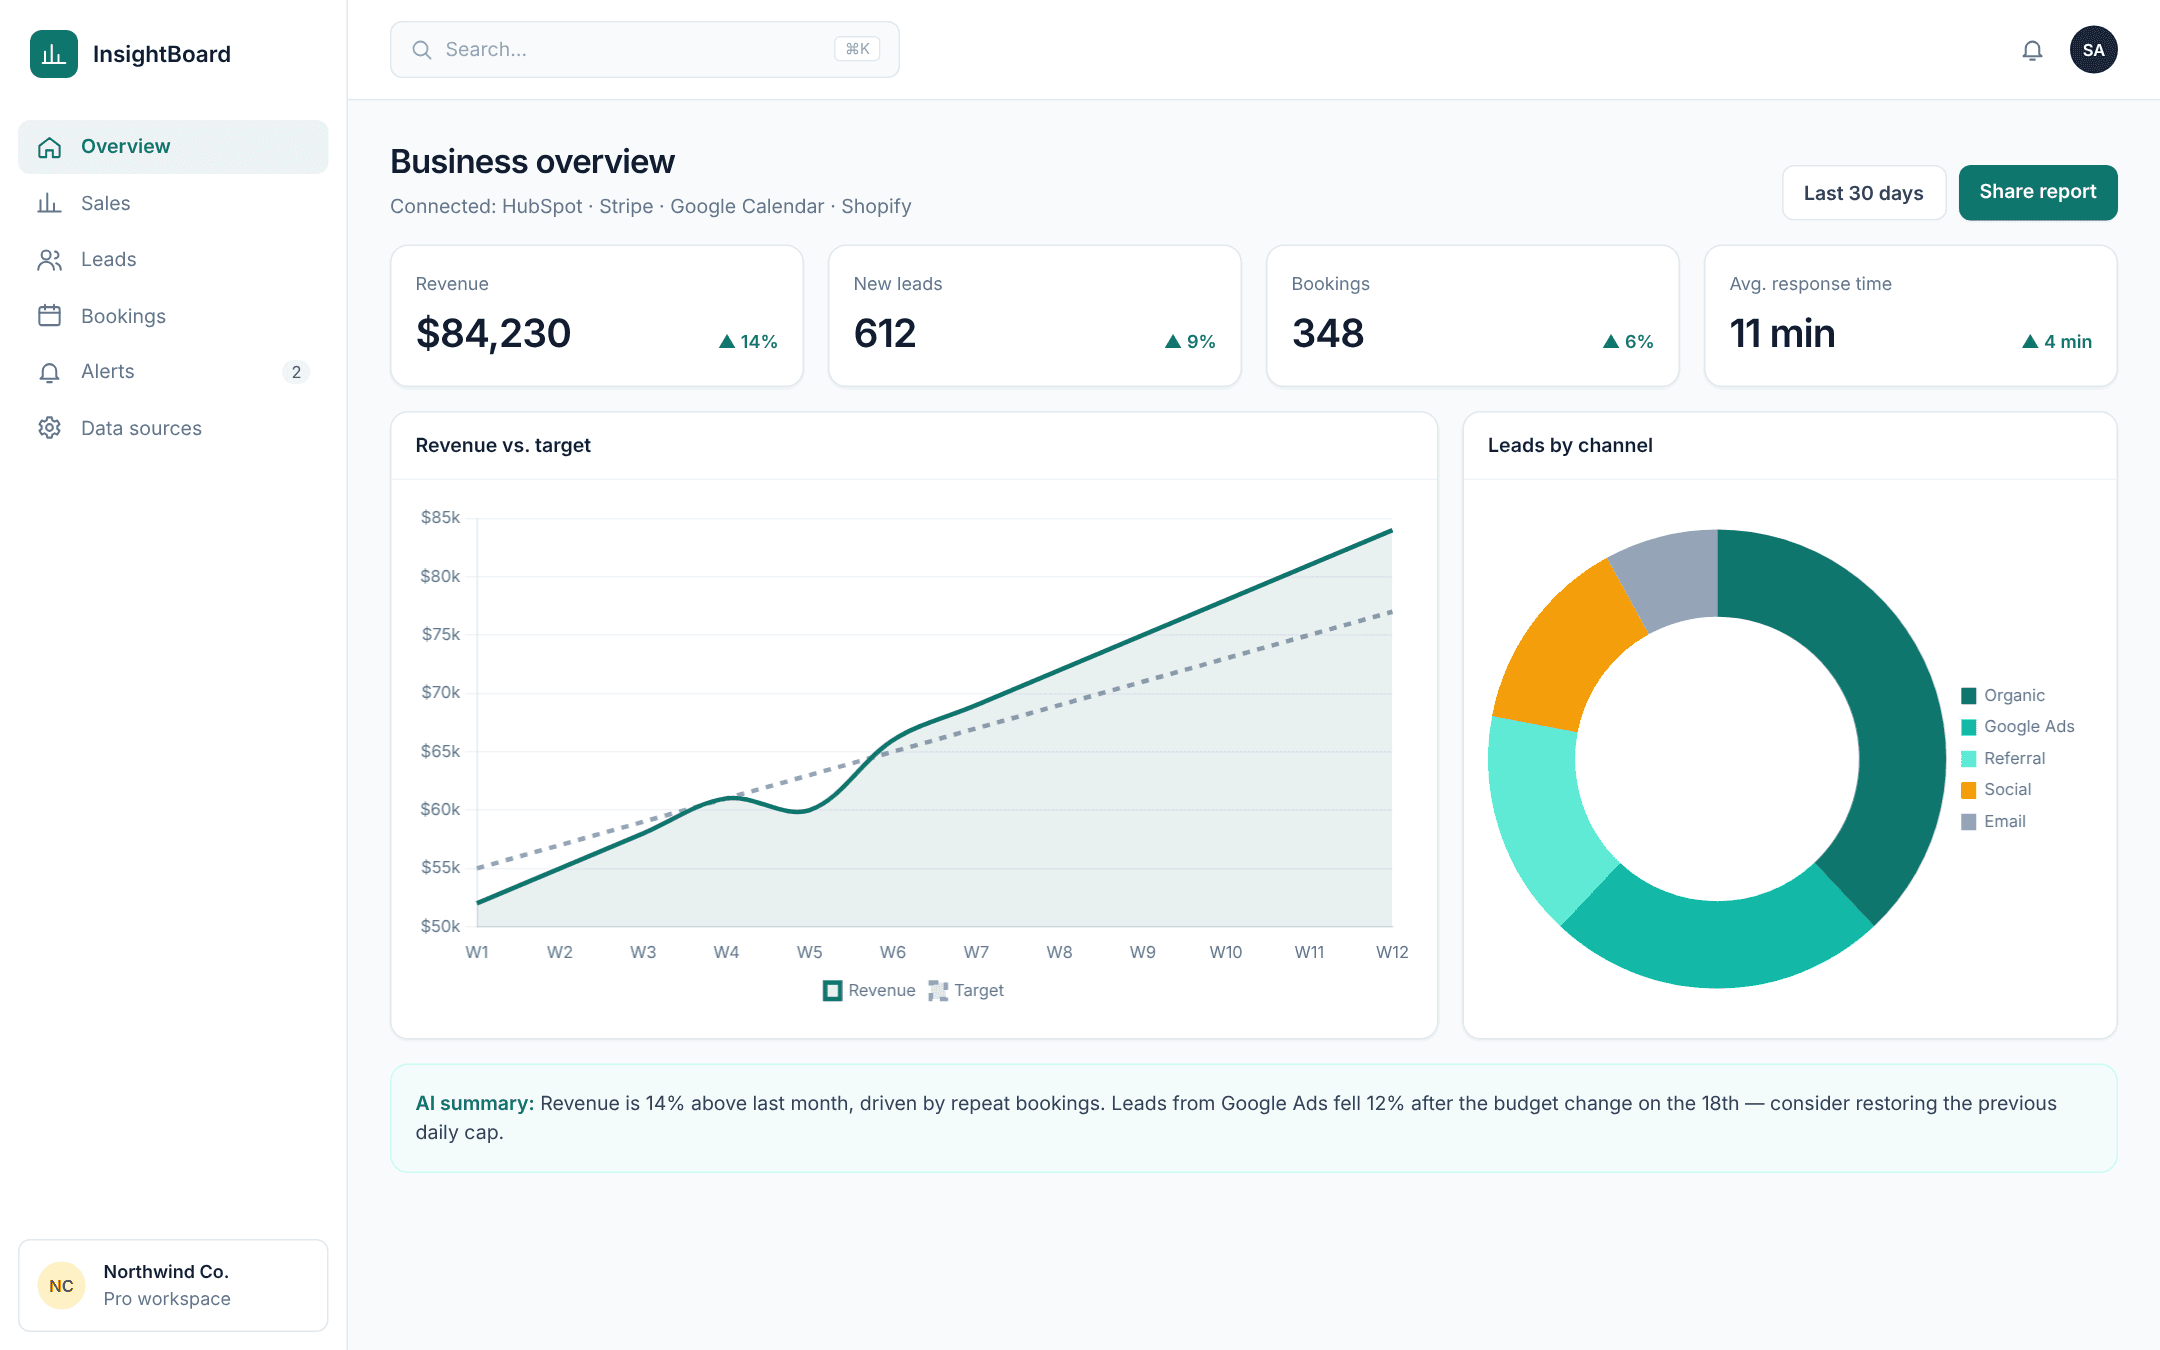
We connect your data sources and design dashboards that answer the questions your team actually asks — with accurate metrics, sensible visual design and alerts when something needs attention.
Overview
When data lives in a CRM, an accounting tool, an e-commerce platform and several spreadsheets, answering simple questions takes hours — and different reports often disagree. A well-designed dashboard brings those sources together and shows the numbers that drive decisions.
We start by agreeing clear metric definitions with your team, then connect sources, model the data and design dashboards that are easy to read on any device. Scheduled reports and alerts surface what needs attention, and AI-generated summaries explain notable changes in plain language. For client-facing products, we build embedded analytics directly into your application.
Dashboards & Analytics Systems
Interactive example
Hover, tap or use the controls. Figures are illustrative examples only.
May: 312
Illustrative Data · not client results
Use cases
One trusted view of revenue, pipeline and operations.
Campaign and lead performance across channels.
Live status of orders, bookings or support queues.
Process
We agree KPIs, definitions and who needs which view.
We integrate data sources and build a reliable data model.
We create clear, interactive dashboards and reports.
We add alerts and improve views based on how they are used.
FAQ
Either. We recommend BI tools for internal analysis and custom dashboards for client-facing or embedded use.
We agree metric definitions upfront and validate against source data before launch.
Yes, where the data sources support it.
Related
SaaS & Software
Plan, build and launch AI-powered SaaS products on a scalable foundation.
Explore Service : Custom AI SaaS DevelopmentSaaS & Software
A focused first release that validates your idea with real users, fast.
Explore Service : SaaS MVP DevelopmentSaaS & Software
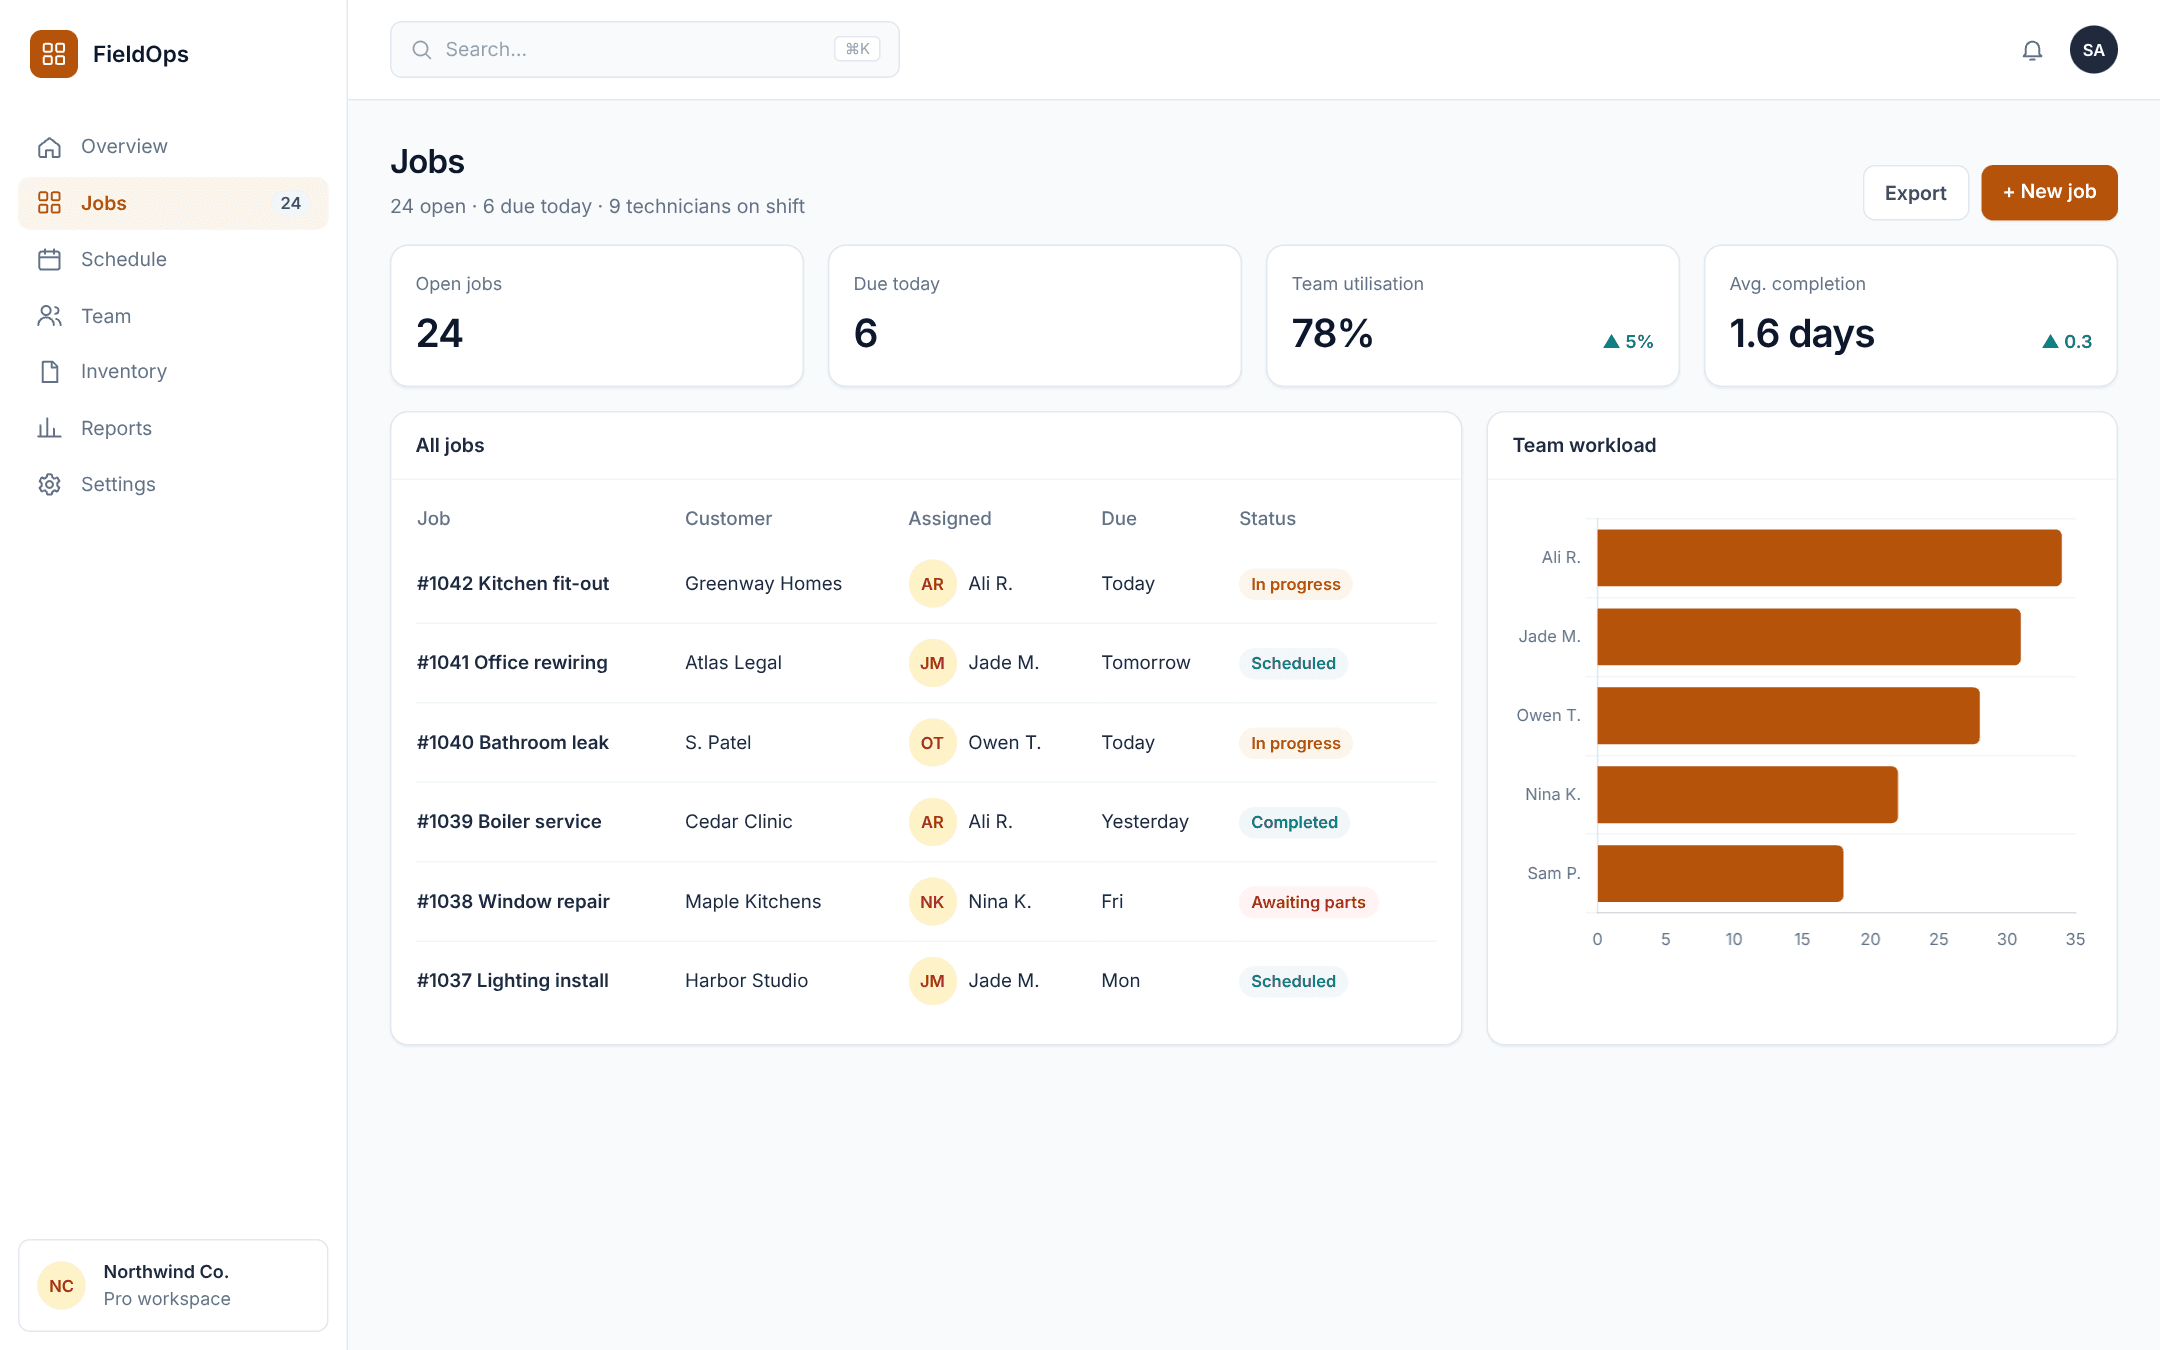
Internal tools and operations platforms built for your exact workflow.
Explore Service : Custom Business SoftwareTell us what you want to build. We'll reply with honest next steps — whether that's a quick automation, a SaaS product or a playable prototype.